| Total number of complaints received | Number of Stage 1 closed complaints | Number of Stage 2 closed complaints | Complaints still open |
|---|---|---|---|
| 20 | 18 | 0 | 2 |
*A note to Complaints still open. Complaints received during this period but not closed – both complaints still open during this period are compliant with timescales.
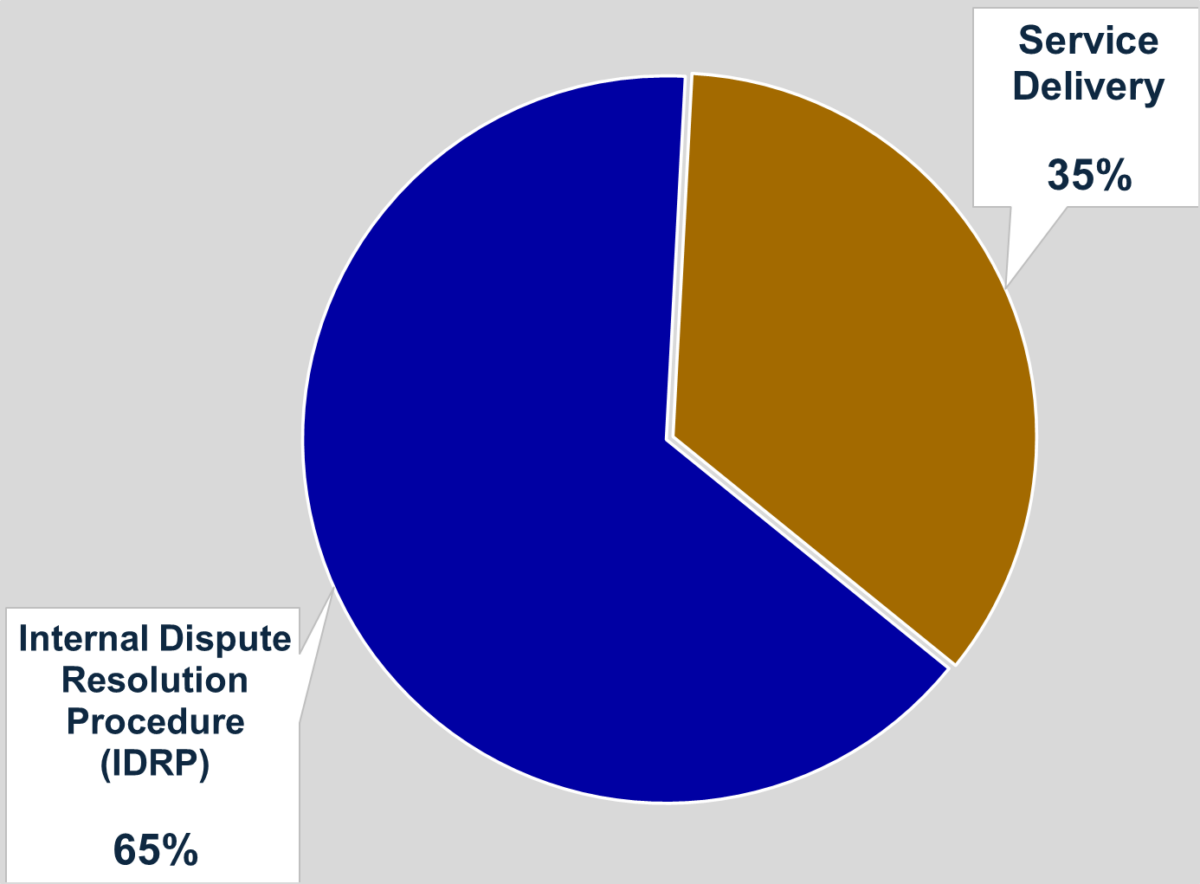
Types of complaint (all complaints)

- 65% of all complaints were related to Internal Dispute Resolution Procedure.
- 35% of all complaints were related to service delivery.
Complaint Outcomes
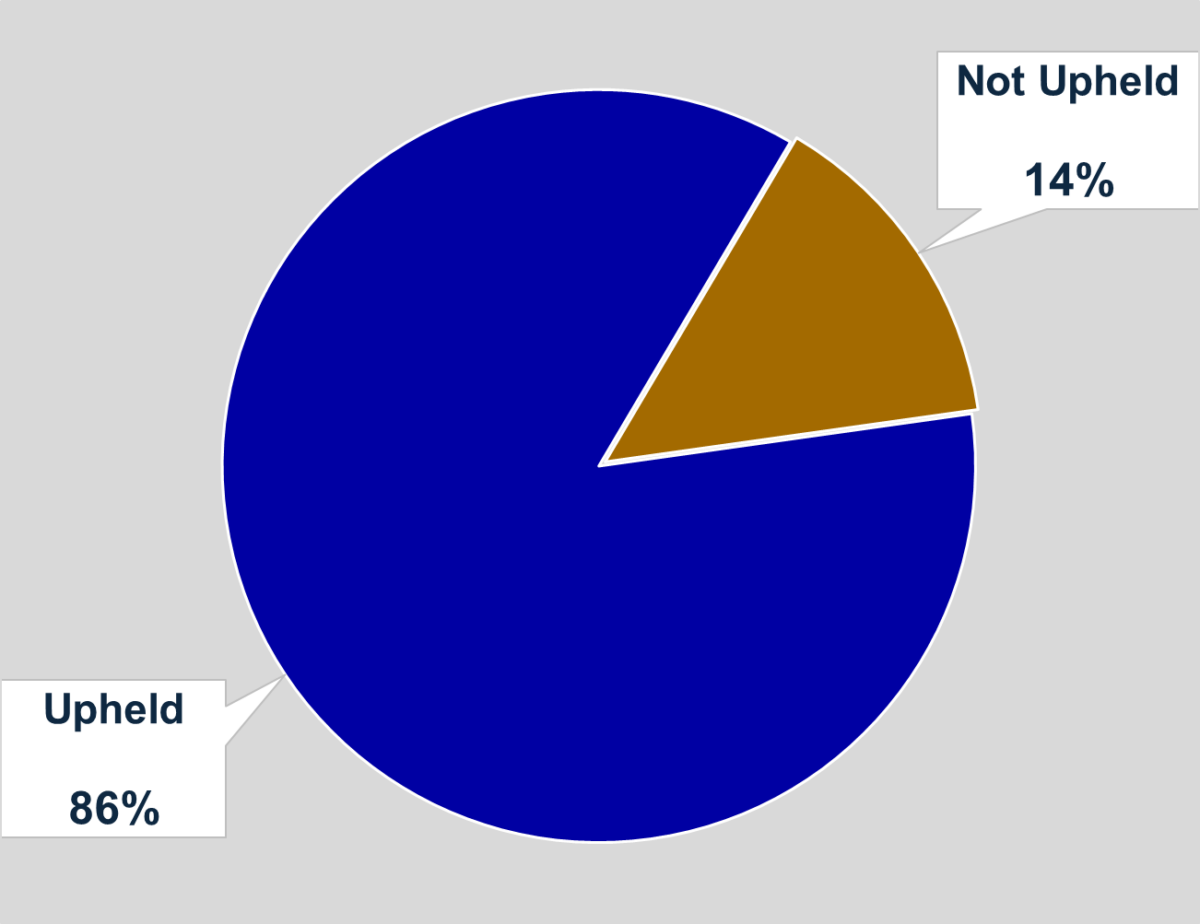
Service Delivery

- 86% of service delivery complaints were upheld.
- 14% of service delivery complaints were not upheld.
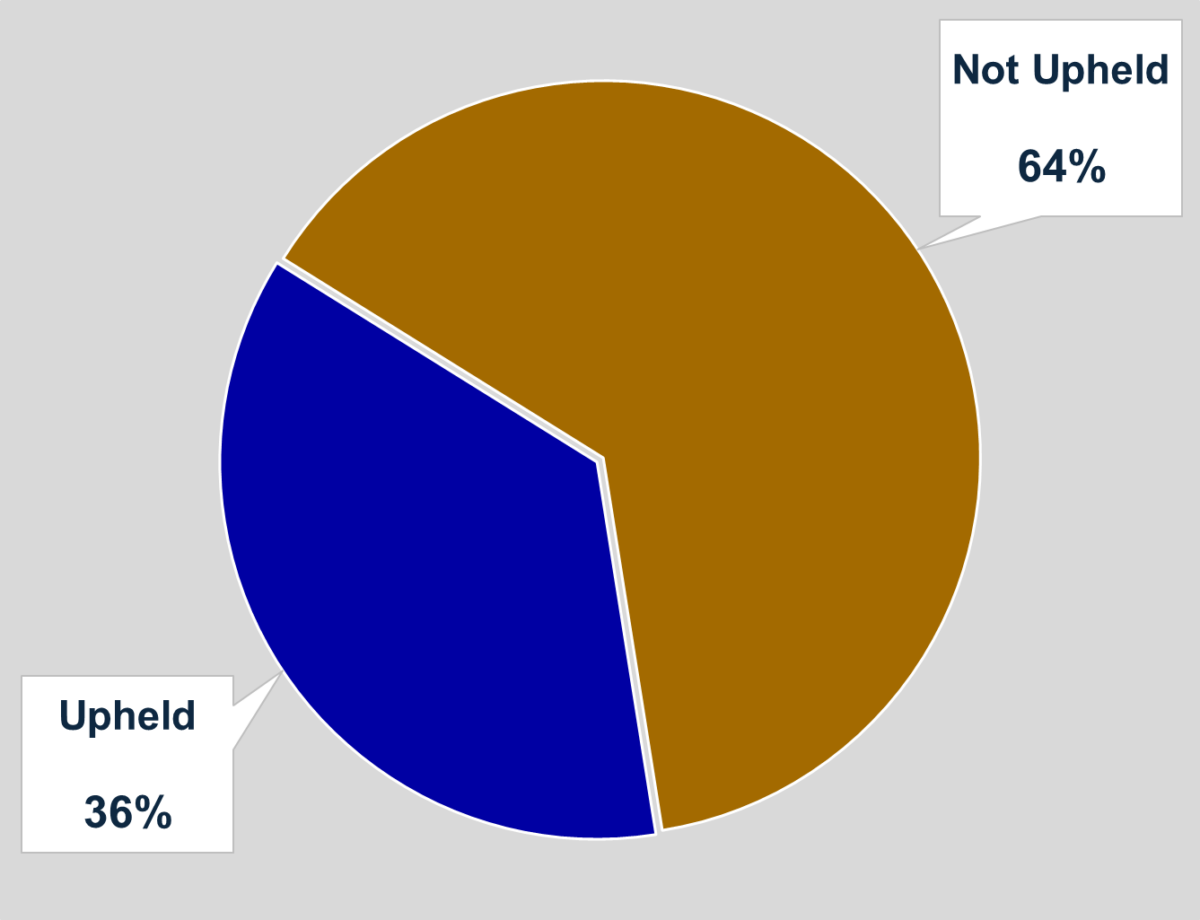
IDRP Complaints

- 64% of IDRP complaints were not upheld.
- 36% of IDRP complaints were upheld.
Lessons Learned
- All documents not in English must be translated immediately upon receipt.
- All Power of Attorney documentation will require authorisation from the Payroll Manager prior to action.