| Total number of complaints received | Number of Stage 1 closed complaints | Number of State 2 closed complaints | Complaints still open |
|---|---|---|---|
| 19 | 17 | 2 | 0 |
Types of complaint (all complaints)

- 68% of all complaints were related to the Internal Dispute Resolute Procedure.
- 32% of all complaints were related to Service Delivery.
Complaints Outcomes
Service Delivery
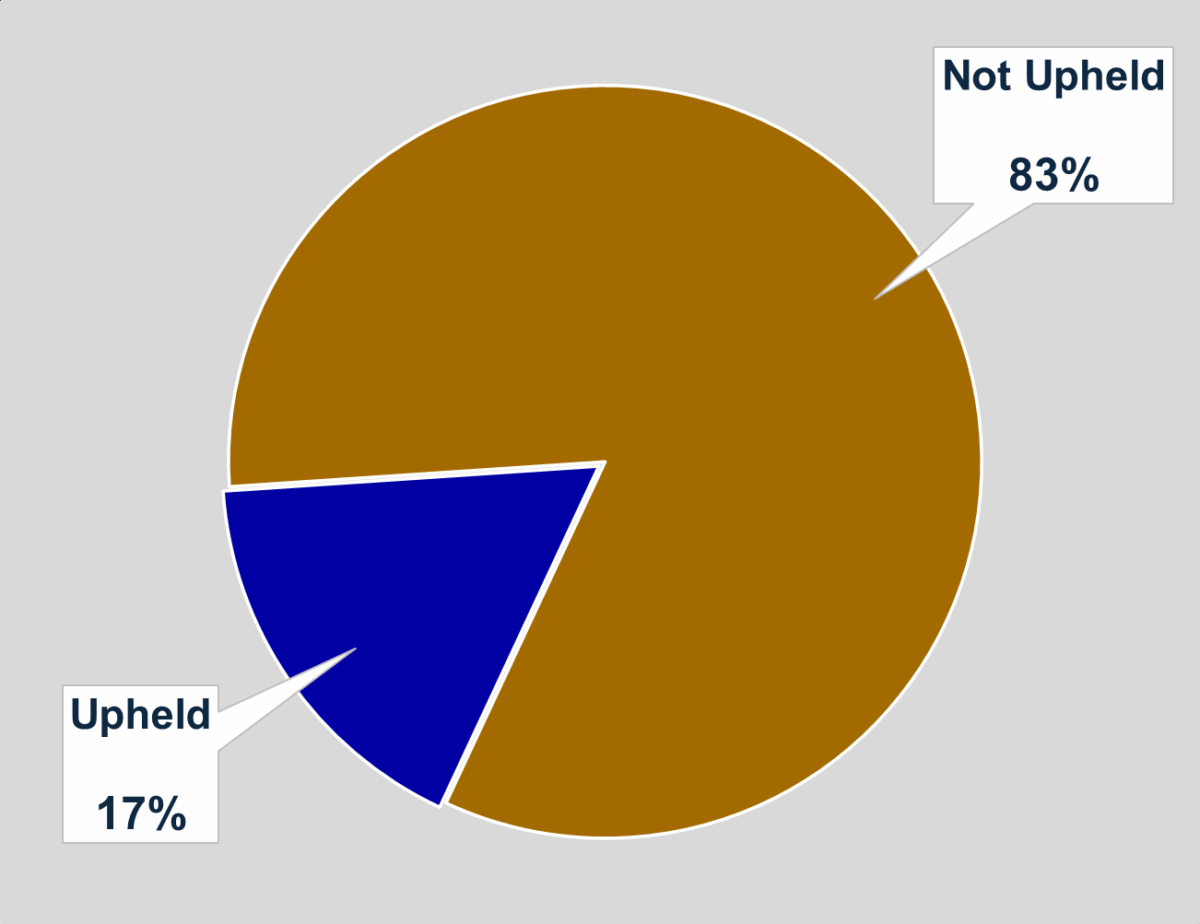
- 17% of service delivery complaints were upheld.
- 83% of service delivery complaints were not upheld.
IDRP Complaints

- 92% of IDRP complaints were upheld.
- 8% of IDRP complaints were not upheld.